 To
see the state of a function call stack while your program is suspended
at a breakpoint, choose View
To
see the state of a function call stack while your program is suspended
at a breakpoint, choose View  Trace Stack from the VLISP
menu, or click the Trace toolbar button. VLISP displays the Trace
Stack window:
Trace Stack from the VLISP
menu, or click the Trace toolbar button. VLISP displays the Trace
Stack window:
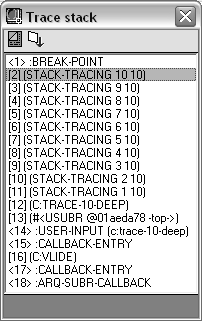
The Trace Stack window displayed above shows a function call frame for the stack-tracing function. The second element, or frame, in the trace stack is highlighted:
[2] (STACK-TRACING 10 10)
The number [2] simply identifies it as the second element in the stack. The numbers following the stack-tracing function name (10 10) indicate the actual values that were passed to the function.


